Federal Reserve Economic Data
- Release Calendar
- FRED Tools
- FRED News
- FRED Blog
- About FRED
Data in this graph are copyrighted. Please review the copyright information in the series notes before sharing.
Notes
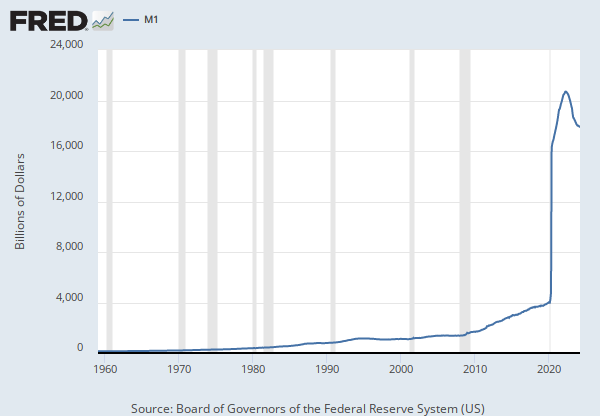
Source: Board of Governors of the Federal Reserve System (US)
Release: H.6 Money Stock Measures
Units: Billions of Dollars, Not Seasonally Adjusted
Frequency: Monthly
Notes:
This series has been discontinued and will no longer be updated. It has been consolidated under the following series, which will continue to be updated: MDLM.
Starting on February 23, 2021, the H.6 statistical release is now published at a monthly frequency and contains only monthly average data needed to construct the monetary aggregates. Components of the monetary aggregates are reported at a total industry level without a breakdown by banks and thrifts. For further information about the changes to the H.6 Statistical Release, see the announcements provided by the source.
Demand deposits plus other checkable deposits. Calculated by the Federal Reserve Bank of St. Louis.
Suggested Citation:
Board of Governors of the Federal Reserve System (US), Total Checkable Deposits (DISCONTINUED) [TCDNS], retrieved from FRED, Federal Reserve Bank of St. Louis; https://fred.stlouisfed.org/series/TCDNS, .
Release Tables
Related Data and Content
Data Suggestions Based On Your Search
Content Suggestions
Other Formats
Related Categories
Releases
Tags
Permalink/Embed
modal open, choose link customization options
Select automatic updates to the data or a static time frame. All data are subject to revision.


