Federal Reserve Economic Data
- Release Calendar
- FRED Tools
- FRED News
- FRED Blog
- About FRED
Data in this graph are copyrighted. Please review the copyright information in the series notes before sharing.
Notes
Source: Center for Financial Stability
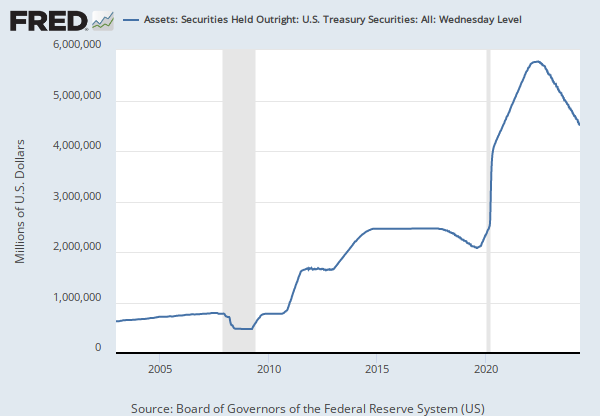
Release: The Federal Reserve System's Weekly Balance Sheet Since 1914
Units: Millions of U.S. Dollars, Not Seasonally Adjusted
Frequency: Weekly, Ending Wednesday
Notes:
This series is calculated by the authors both between November 20, 1914 and April 8, 1953, and after December 11, 2002. It was part of the original press release only between April 15, 1953 and December 4, 2002.
Data before Wednesday, April 27, 1921 represent weekly values as of Friday.
Authors: Cecilia Bao, Justin Chen, Nicholas Fries, Andrew Gibson, Emma Paine, and Kurt Schuler
Studies in Applied Economics no. 115, Johns Hopkins University Institute for Applied Economics, Global Health, and the Study of Business Enterprise, July 2018; co-published with the Center for Financial Stability
Suggested Citation:
Center for Financial Stability, Resources and Assets: U.S. Government Securities: Bought or Held Outright: Total Bought Outright [RAGSOTBO], retrieved from FRED, Federal Reserve Bank of St. Louis; https://fred.stlouisfed.org/series/RAGSOTBO, .
Release Tables
Related Data and Content
Data Suggestions Based On Your Search
Content Suggestions
Related Categories
Releases
Tags
Permalink/Embed
modal open, choose link customization options
Select automatic updates to the data or a static time frame. All data are subject to revision.


