Federal Reserve Economic Data
- Release Calendar
- FRED Tools
- FRED News
- FRED Blog
- About FRED
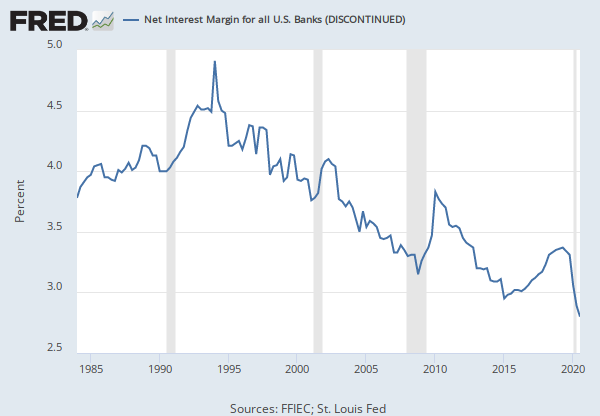
Data in this graph are copyrighted. Please review the copyright information in the series notes before sharing.
Notes
Source: Federal Deposit Insurance Corporation
Release: FDIC Quarterly Banking Profile
Units: Millions of U.S. Dollars, Not Seasonally Adjusted
Frequency: Quarterly
Notes:
This series is found in Quarterly Income and Expense of FDIC-Insured Commercial Banks and Savings Institutions.
The Quarterly Banking Profile is a quarterly publication that provides the earliest comprehensive summary of financial results for all FDIC-insured institutions.
See Notes to Users for more information.
Suggested Citation:
Federal Deposit Insurance Corporation, Income and Expense: Total Noninterest Income: Trading Account Gains and Fees: Credit Exposures [QBPQYTNIYTRDGNCRDEX], retrieved from FRED, Federal Reserve Bank of St. Louis; https://fred.stlouisfed.org/series/QBPQYTNIYTRDGNCRDEX, .
Release Tables
Permalink/Embed
modal open, choose link customization options
Select automatic updates to the data or a static time frame. All data are subject to revision.


