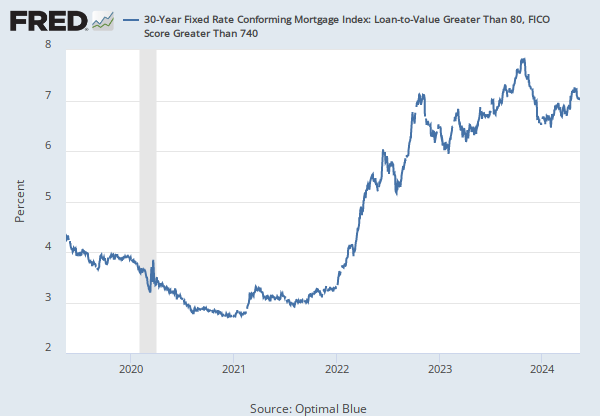
Federal Reserve Economic Data: Your trusted data source since 1991

30-Year Fixed Rate FHA Mortgage Index (OBMMIFHA30YF)

Observation:

2024-04-30: 6.909 (+ more)   Updated: May 1, 2024 7:05 AM CDT
2024-04-30:  6.909  
2024-04-29:  6.910  
2024-04-26:  6.860  
2024-04-25:  6.915  
2024-04-24:  6.885  
View All

Units:

Percent,
Not Seasonally Adjusted

Frequency:

Daily

NOTES

Source: Optimal Blue  

Release: Optimal Blue Mortgage Market Indices  

Units:  Percent, Not Seasonally Adjusted

Frequency:  Daily

Notes:

This index includes rate locks from Federal Housing Authority loans.

Optimal Blue Mortgage Market Indices™ (OBMMI™) is calculated from actual locked rates with consumers across over one-third of all mortgage transactions nationwide. OBMMI includes multiple mortgage pricing indices developed around the most popular products and specific borrower and loan level attributes.

Each index is calculated as the average of all appropriate rate locks locked through the Optimal Blue product eligibility and pricing engine on a given day. More details about methodology and definitions are available here.

Suggested Citation:

Optimal Blue, 30-Year Fixed Rate FHA Mortgage Index [OBMMIFHA30YF], retrieved from FRED, Federal Reserve Bank of St. Louis; https://fred.stlouisfed.org/series/OBMMIFHA30YF, May 1, 2024.

RELEASE TABLES

Optimal Blue Mortgage Market Indices

Subscribe to the FRED newsletter


Follow us

Back to Top
Top