Federal Reserve Economic Data
- Release Calendar
- FRED Tools
- FRED News
- FRED Blog
- About FRED
Data in this graph are copyrighted. Please review the copyright information in the series notes before sharing.
NOTES
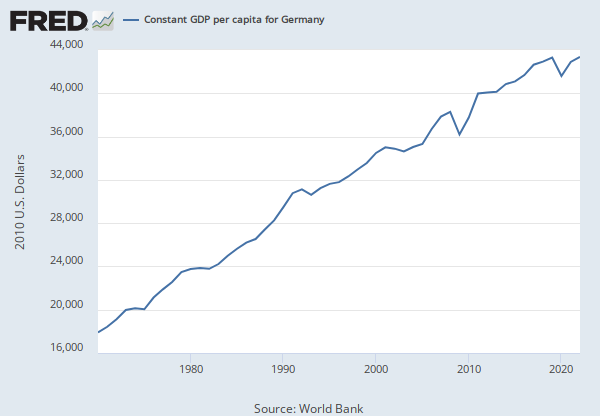
Source: World Bank
Release: World Development Indicators
Units: 2010 U.S. Dollars, Not Seasonally Adjusted
Frequency: Annual
Notes:
GDP per capita is gross domestic product divided by midyear population. GDP is the sum of gross value added by all resident producers in the economy plus any product taxes and minus any subsidies not included in the value of the products. It is calculated without making deductions for depreciation of fabricated assets or for depletion and degradation of natural resources.
World Bank national accounts data, and OECD National Accounts data files.
Suggested Citation:
World Bank, Constant GDP per capita for India [NYGDPPCAPKDIND], retrieved from FRED, Federal Reserve Bank of St. Louis; https://fred.stlouisfed.org/series/NYGDPPCAPKDIND, .
RELEASE TABLES
RELATED DATA AND CONTENT
Data Suggestions Based On Your Search
Content Suggestions
Related Categories
Releases
Tags
Permalink/Embed
modal open, choose link customization options


