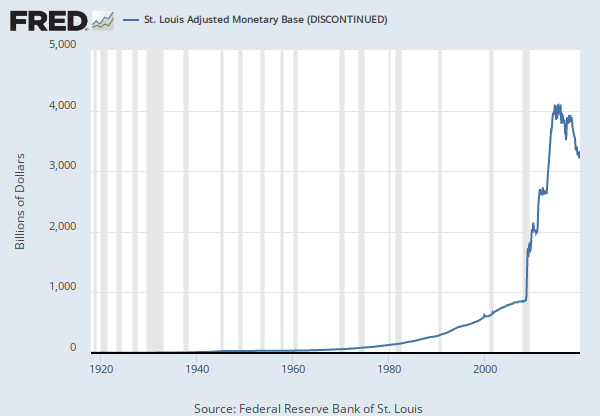
Observations
Dec 1970: 11,105 | Millions of Dollars | Monthly
Updated: Aug 20, 2012 8:34 AM CDT
Next Release Date: Not Available
Observations
Dec 1970: | 11,105 | |
Nov 1970: | 11,117 | |
Oct 1970: | 11,117 | |
Sep 1970: | 11,300 | |
Aug 1970: | 11,367 | |
View All |
Units:
Frequency:
Data in this graph are copyrighted. Please review the copyright information in the series notes before sharing.
Source: National Bureau of Economic Research
Release: NBER Macrohistory Database
Units: Millions of Dollars, Not Seasonally Adjusted
Frequency: Monthly
Series Is Presented Here As Three Variables--(1)--Original Data, 1878-1914 (2)--Original Data, 1914-1946 (3)--Original Data, 1947-1970. Data Reflect Monthly Averages Of Daily Figures. Source: Federal Reserve Board, Federal Reserve Bulletins, 1947 And Following Issues.
This NBER data series m14076c appears on the NBER website in Chapter 14 at http://www.nber.org/databases/macrohistory/contents/chapter14.html.
NBER Indicator: m14076c
National Bureau of Economic Research, Monetary Gold Stock for United States [M1476CUSM144NNBR], retrieved from FRED, Federal Reserve Bank of St. Louis; https://fred.stlouisfed.org/series/M1476CUSM144NNBR, .
modal open, choose link customization options
Select automatic updates to the data or a static time frame. All data are subject to revision.