Federal Reserve Economic Data
- Release Calendar
- FRED Tools
- FRED News
- FRED Blog
- About FRED
Data in this graph are copyrighted. Please review the copyright information in the series notes before sharing.
NOTES
Source: National Bureau of Economic Research
Release: NBER Macrohistory Database
Units: Percent, Seasonally Adjusted
Frequency: Monthly
Notes:
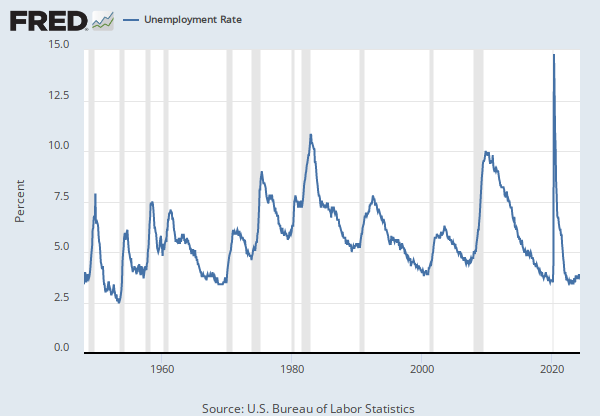
These Figures Represent The Number Of Persons Unemployed 15 Weeks And Over As A Per Cent Of The Total Civilian Labor Force. Beginning In 1960, Data Include Alaska And Hawaii. Population Data From The 1960 Census Were Introduced In April 1962. This Resulted In A Slight Reduction In Labor Force Totals, But None In The Estimates Of Unemployment. Population Data From The 1950 Census Were Used Prior To April 1962. Source: Bureau Of Labor Statistics, Monthly Report On The Labor Force, March, 1969, P. 161, For 1948-1968 Data, And Subsequent Issues Of Monthly Report On The Labor Force Thereafter.
This NBER data series m08320 appears on the NBER website in Chapter 8 at http://www.nber.org/databases/macrohistory/contents/chapter08.html.
NBER Indicator: m08320
Suggested Citation:
National Bureau of Economic Research, Unemployment Rate, Per Cent of Persons Unemployed 15 Weeks and Over for United States [M08320USM156SNBR], retrieved from FRED, Federal Reserve Bank of St. Louis; https://fred.stlouisfed.org/series/M08320USM156SNBR, .


