Federal Reserve Economic Data
- Release Calendar
- FRED Tools
- FRED News
- FRED Blog
- About FRED
Data in this graph are copyrighted. Please review the copyright information in the series notes before sharing.
Notes
Source: National Bureau of Economic Research
Release: NBER Macrohistory Database
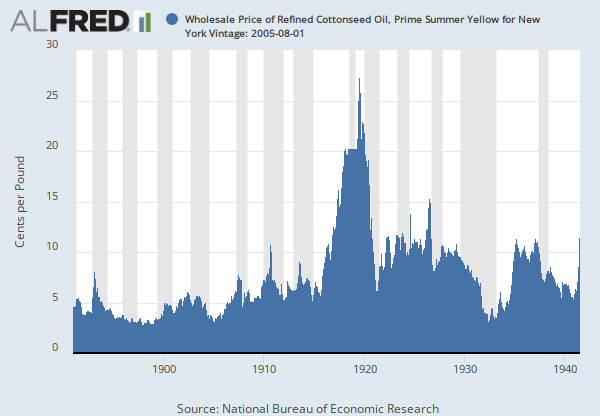
Units: Cents per Pound, Not Seasonally Adjusted
Frequency: Monthly
Notes:
Data Refers To Cents Per Pound In Car Lots Through 07/1930 And In Tank Cars Thereafter. Data Is The Average Spot Price. 1891-1908: Data Was Compiled From "Oil, Paint, And Drug Reporter", 11/7/1910, P. 40. The Average Price Per Gal- Lon Was Divided By 7.5 To Convert To Pounds. 1909-1921: Data Is From Annual Reports Of The New York Produce Exchange. 1922-1941: Data Is From "Oil, Paint, And Drug Reporter" And Is The Average Of Daily Ranges. Source: Usda, "Agriculture Yearbook", 1924, P. 766 And Later Yearbooks; Also Editions Of "Agricultural Statistics" (Usda) And "Wholesale Prices" (Bureau Of Labor Statistics)
This NBER data series m04081aa appears on the NBER website in Chapter 4 at http://www.nber.org/databases/macrohistory/contents/chapter04.html.
NBER Indicator: m04081aa
Suggested Citation:
National Bureau of Economic Research, Wholesale Price of Refined Cottonseed Oil, Prime Summer Yellow for New York [M041AAUS000NYM267NNBR], retrieved from FRED, Federal Reserve Bank of St. Louis; https://fred.stlouisfed.org/series/M041AAUS000NYM267NNBR, .
Release Tables
Related Data and Content
Data Suggestions Based On Your Search
Content Suggestions
Related Categories
Releases
Tags
Permalink/Embed
modal open, choose link customization options
Select automatic updates to the data or a static time frame. All data are subject to revision.


