Federal Reserve Economic Data
- Release Calendar
- FRED Tools
- FRED News
- FRED Blog
- About FRED
Data in this graph are copyrighted. Please review the copyright information in the series notes before sharing.
Notes
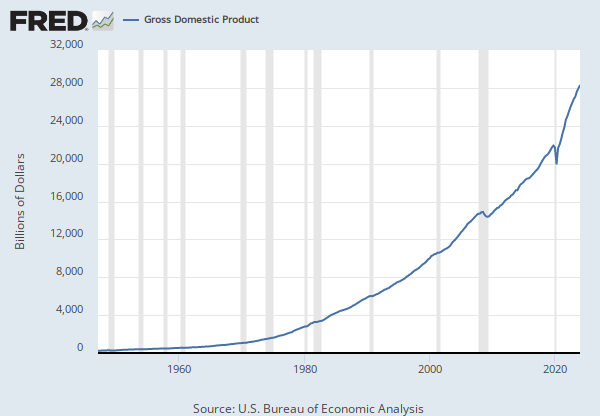
Source: U.S. Bureau of Economic Analysis
Release: Gross Domestic Product
Units: Billions of Chained 2009 Dollars, Seasonally Adjusted Annual Rate
Frequency: Quarterly
Notes:
This series has been discontinued and will no longer be updated. It was a duplicate of the following series, which will continue to be updated: https://fred.stlouisfed.org/series/GDPC1
A Guide to the National Income and Product Accounts of the United States (NIPA) - (http://www.bea.gov/national/pdf/nipaguid.pdf)
Suggested Citation:
U.S. Bureau of Economic Analysis, Real Gross Domestic Product (DISCONTINUED) [GDPC96], retrieved from FRED, Federal Reserve Bank of St. Louis; https://fred.stlouisfed.org/series/GDPC96, .
Release Tables
Related Data and Content
Data Suggestions Based On Your Search
Content Suggestions
Other Formats
Related Categories
Releases
Tags
Permalink/Embed
modal open, choose link customization options
Select automatic updates to the data or a static time frame. All data are subject to revision.


