Federal Reserve Economic Data
- Release Calendar
- FRED Tools
- FRED News
- FRED Blog
- About FRED
Data in this graph are copyrighted. Please review the copyright information in the series notes before sharing.
Notes
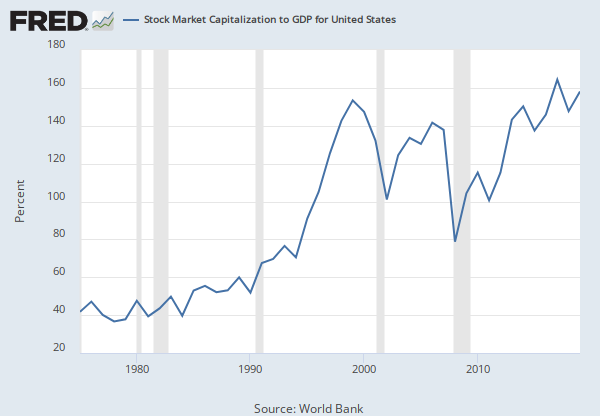
Source: World Bank
Release: Global Financial Development
Units: Percent, Not Seasonally Adjusted
Frequency: Annual
Notes:
Ratio of gross portfolio equity assets to GDP. Equity assets include shares, stocks, participation, and similar documents (such as American depository receipts) that usually denote ownership of equity.
Ratio of gross portfolio equity assets to GDP. Equity assets include shares, stocks, participation, and similar documents (such as American depository receipts) that usually denote ownership of equity. Raw data are from the electronic version of the IMF's International Financial Statistics. IFS line 79ADDZF / GDP. Local currency GDP is from IFS (line 99B..ZF or, if not available, line 99B.CZF). Missing observations are imputed by using GDP growth rates from World Development Indicators, instead of substituting the levels. This approach ensures a smoother GDP series. (International Monetary Fund, International Financial Statistics)
Source Code: GFDD.DM.09
Suggested Citation:
World Bank, Gross Portfolio Equity Assets to GDP for Finland [DDDM09FIA156NWDB], retrieved from FRED, Federal Reserve Bank of St. Louis; https://fred.stlouisfed.org/series/DDDM09FIA156NWDB, .
Release Tables
Related Data and Content
Data Suggestions Based On Your Search
Content Suggestions
Related Categories
Releases
Tags
Permalink/Embed
modal open, choose link customization options
Select automatic updates to the data or a static time frame. All data are subject to revision.


