Federal Reserve Economic Data
- Release Calendar
- FRED Tools
- FRED News
- FRED Blog
- About FRED
Data in this graph are copyrighted. Please review the copyright information in the series notes before sharing.
Notes
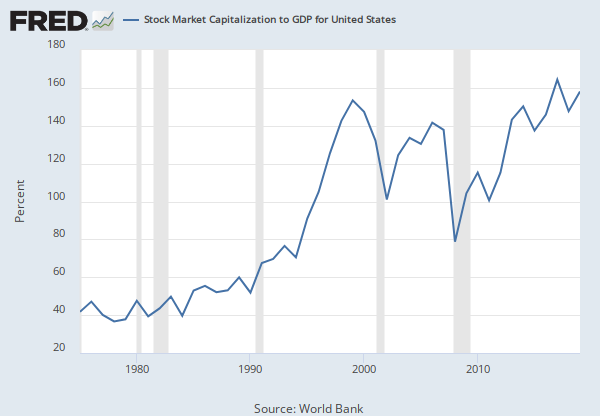
Source: World Bank
Release: Global Financial Development
Units: Percent, Not Seasonally Adjusted
Frequency: Annual
Notes:
Total value of all listed shares in a stock market as a percentage of GDP.
Value of listed shares to GDP, calculated using the following deflation method: {(0.5)*[Ft/P_et + Ft-1/P_et-1]}/[GDPt/P_at] where F is stock market capitalization, P_e is end-of period CPI, and P_a is average annual CPI. End-of period CPI (IFS line 64M..ZF or, if not available, 64Q..ZF) and annual CPI (IFS line 64..ZF) are from the IMF's International Financial Statistics. Standard & Poor's, Global Stock Markets Factbook and supplemental S&P data)
Source Code: GFDD.DM.01
Suggested Citation:
World Bank, Stock Market Capitalization to GDP for Panama [DDDM01PAA156NWDB], retrieved from FRED, Federal Reserve Bank of St. Louis; https://fred.stlouisfed.org/series/DDDM01PAA156NWDB, .
Release Tables
Related Data and Content
Data Suggestions Based On Your Search
Content Suggestions
Related Categories
Releases
Tags
Permalink/Embed
modal open, choose link customization options
Select automatic updates to the data or a static time frame. All data are subject to revision.


