Federal Reserve Economic Data
Notes
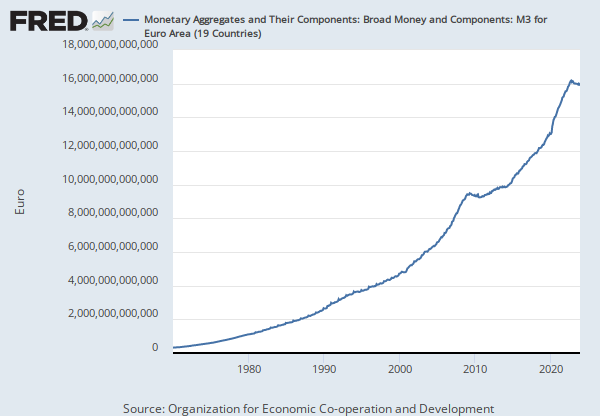
Source: Organization for Economic Co-operation and Development
Release: Main Economic Indicators
Units:
Frequency:
Notes:
OECD descriptor ID: BPFADI03
OECD unit ID: CXCU
OECD country ID: EA17
All OECD data should be cited as follows: OECD, "Main Economic Indicators - complete database", Main Economic Indicators (database),http://dx.doi.org/10.1787/data-00052-en (Accessed on date)
Copyright, 2016, OECD. Reprinted with permission.
Suggested Citation:
Organization for Economic Co-operation and Development, Financial Account: Liabilities: Direct Foreign Investment in Reporting Country for the Euro Area (DISCONTINUED) [BPFADI03EZA637N], retrieved from FRED, Federal Reserve Bank of St. Louis; https://fred.stlouisfed.org/series/BPFADI03EZA637N, .
Related Data and Content
Data Suggestions Based On Your Search


Content Suggestions


Other Formats
National currency, Sum Over Component Sub-periods, Annual, Not Seasonally Adjusted
National currency, Sum Over Component Sub-periods, Quarterly, Not Seasonally Adjusted
Quarterly, Not Seasonally Adjusted
Related Categories
Euro Area
Institutions
International Finance
Trade & International Transactions
National Accounts
Indicators
International Data