Federal Reserve Economic Data
- Release Calendar
- FRED Tools
- FRED News
- FRED Blog
- About FRED
Data in this graph are copyrighted. Please review the copyright information in the series notes before sharing.
Notes
Source: U.S. Census Bureau
Release: Manufacturer's Shipments, Inventories, and Orders (M3) Survey
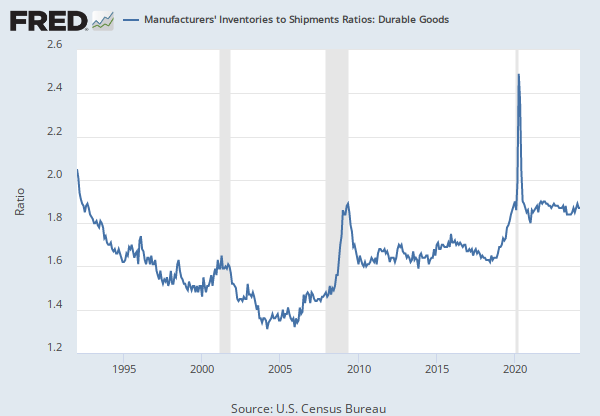
Units: Ratio, Seasonally Adjusted
Frequency: Monthly
Notes:
Unfilled Orders to Shipments Ratio Excludes Semiconductor Manufacturing. Also, the Ratio of Unfilled Orders to Shipments excludes the following industries with no unfilled orders: Wood products; nonmetallic mineral products; medical equipment and supplies; office supplies; other miscellaneous manufacturing; cutlery and handtools; farm and garden machinery; computer storage and peripheral devices; audio and video equipment; manufacturing and reproducing magnetic and optical media; batteries; automobiles; light trucks and utility vehicles; heavy duty trucks; and miscellaneous furniture.
Suggested Citation:
U.S. Census Bureau, Manufacturers' Unfilled Orders to Shipments Ratios: Durable Goods [AMDMUS], retrieved from FRED, Federal Reserve Bank of St. Louis; https://fred.stlouisfed.org/series/AMDMUS, .
Release Tables
Related Data and Content
Data Suggestions Based On Your Search
Content Suggestions
Other Formats
Related Categories
Releases
Tags
Permalink/Embed
modal open, choose link customization options
Select automatic updates to the data or a static time frame. All data are subject to revision.


